Sending JMX Metrics to Sumo Logic Unified Metrics
A short walkthrough of how we started sending our JMX metrics to the new Sumo Logic Metrics solution.
We’ve been using Sumo Logic for logs and were excited to have one tool and dashboard to visualize logs and metrics! In order to wire this up, we decided to use jmxtrans to regularly pipe the JMX metrics we query with Graphite formatted output to the new Sumo Logic collectors. These collectors can essentially be thought of a hosted version of Graphite.
Step 1: Upgrade/Install Sumo Logic Collectors
There’s a lot of guides out there on this one, but just in case you have existing collectors, they do need to be updated to have the new Graphite source.
Step 2: Add a Graphite Source for the Collector
This step can either be done in the Sumo Logic dashboard or through a local file for the collector that configures the sources. Either way, you will need to decide what port to run the collector on and whether to use TCP or UDP. For our purposes, the standard port of 2003 is sufficient and we don’t have an extremely high volume of metrics with network/CPU concerns to justify UDP.
For configuring this source in the dashboard, the Sumo Logic guide to adding a Graphite source does a pretty thorough walkthrough. To summarize, though, the steps are pretty simple: go to to the collector management page, select the relevant collector, click add source, choose the Graphite source and configure it with the port and TCP/UDP choices. This method is certainly fast to just try out Sumo Logic metrics.
Since we often spin up and down machines, we prefer the local file configuration for Sumo Logic collectors. We have our /etc/sumo.conf list out the following:
name=machine-hostname
ephemeral=true
accessid=secret-sumo-logic-accessid
accesskey=secret-sumo-logic-accesskey
syncSources=/etc/sumo.json
and inside of /etc/sumo.json, we have:
{
  "api.version":"v1",
  "sources":[
    {
      "name":"Graphite",
      "sourceType":"Graphite",
      "category":"metrics-staging",
      "protocol":"TCP",
      "port":2003
     }
  ]
}
Of course in a full deployment, we have many other sources as well. Make sure the port is an integer in the json file. Some of our infrastructure was accidentally converting the int to a string and thus the Graphite source was missing from our collector.
Step 3: Try out the Graphite source
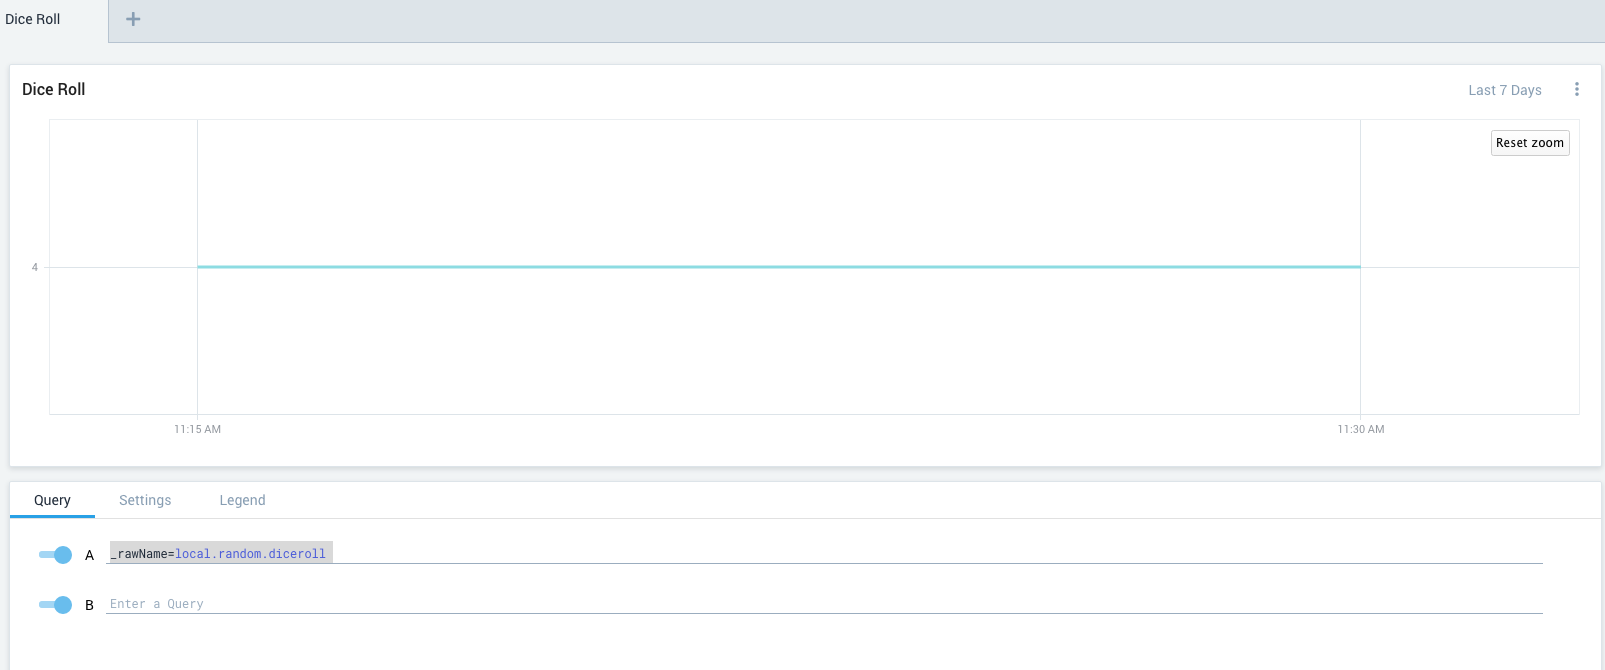
Through either installation method, you should be able to see in the Sumo Logic dashboard the Graphite (otherwise something has gone wrong). From a shell on the installed collector, we’ll use the Graphite suggested sample metric to start getting some data in:
watch -n 20 'echo "local.random.diceroll 4 `date +%s`" | nc localhost 2003'In the Sumo Logic metrics screen, you should be able to run the simple query: _rawName=local.random.diceroll and see a chart that looks like the following:
Step 4: Send the JMX data in
We decided to use the Jmxtrans Agent to ease setup and operation. To get going here, you can download the jmxtrans-agent jar file, and include the java agent as part of the java invocation. Additionally, there is a single XML configuration file that allows you to specify which JMX metrics to query and which output writers to use. The invocation should look something like the following:
java -javaagent:/path/to/jmxtrans-agent-1.2.4.jar=/path/to/jmxtrans-agent.xml -jar app.jarThen in the jmxtrans-agent.xml file, we will include the heap memory metrics we’re interested in with a polling interval of every minute:
<jmxtrans-agent>
  <queries>
    <!-- JVM Memory -->
    <query objectName="java.lang:type=Memory" attribute="HeapMemoryUsage" key="used"
      resultAlias="jvm.heapMemoryUsage.used"/>
    <query objectName="java.lang:type=Memory" attribute="HeapMemoryUsage" key="committed"
      resultAlias="jvm.heapMemoryUsage.committed"/>
  </queries>
  <outputWriter class="org.jmxtrans.agent.GraphitePlainTextTcpOutputWriter">
    <host>localhost</host>
    <port>2003</port>
    <namePrefix>app.</namePrefix>
  </outputWriter>
  <collectIntervalInSeconds>60</collectIntervalInSeconds>
</jmxtrans-agent>
We use the Graphite TCP output writer configured to the Sumo Logic collector we set up to glue this all together. A small aside, since our apps run inside Docker containers with bridge networking and the Sumo Logic collector is on the host VM, we switch the host key in the config file to the Docker bridge IP and all works pretty well. Since the soure host IP collected is from within the Docker bridge IP allocation range, there can be overlap across VMs so some extra care needs to be taken there.
Step 5: Metrics! Graphs! Success!
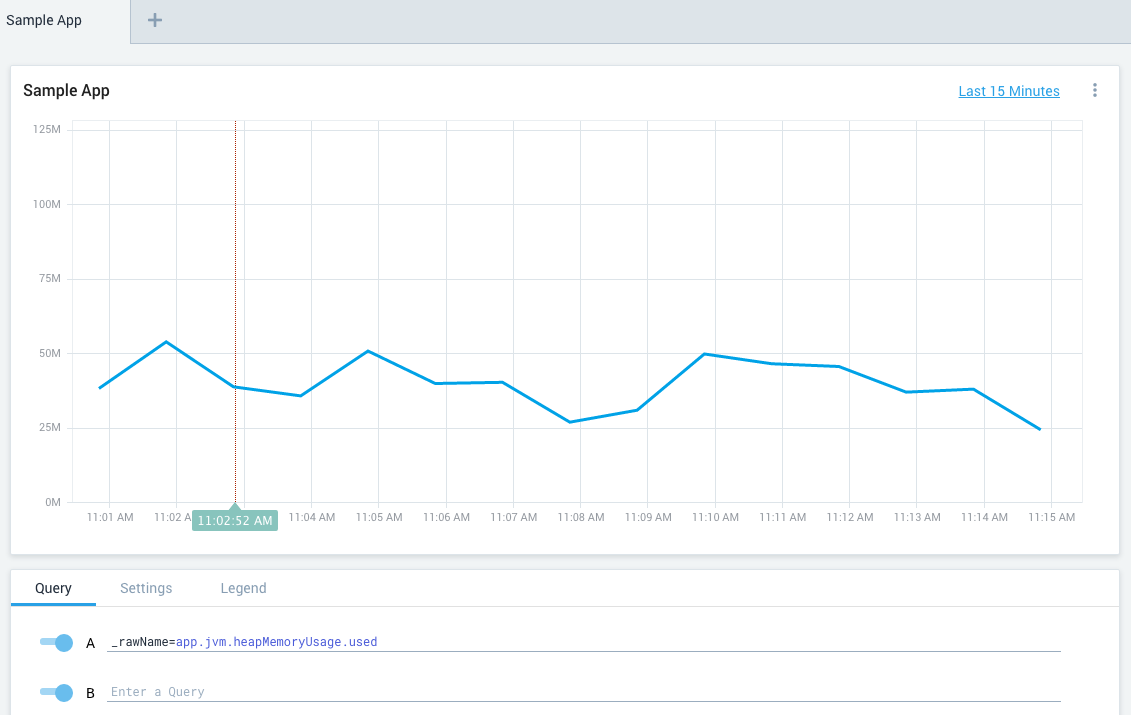
Everything should be wired up at this point and running the query _rawName=app.jvm.heapMemoryUsage.used should very quickly start showing results. Here’s a screenshot of what the heap memory used looks like for a sample Java app:
Future Steps/Improvements
Thanks to jmxtrans, we can quickly collect a new metric that our app starts publishing. Other improvements could also include statsd for pre-aggregating or sampling metrics, switching out the java agent for a separately running jmxtrans that can monitor multiple JVMs, or getting all sorts of other metrics into the Sumo Logic metrics platform to flush out the view (host metrics, AWS CloudWatch, etc).